Three ways to see
what the network is doing
CANTrak focuses on observable network behavior — payload transitions, message frequency, and communication timelines — rather than manufacturer-specific definitions. Each analysis mode answers a distinct diagnostic question.
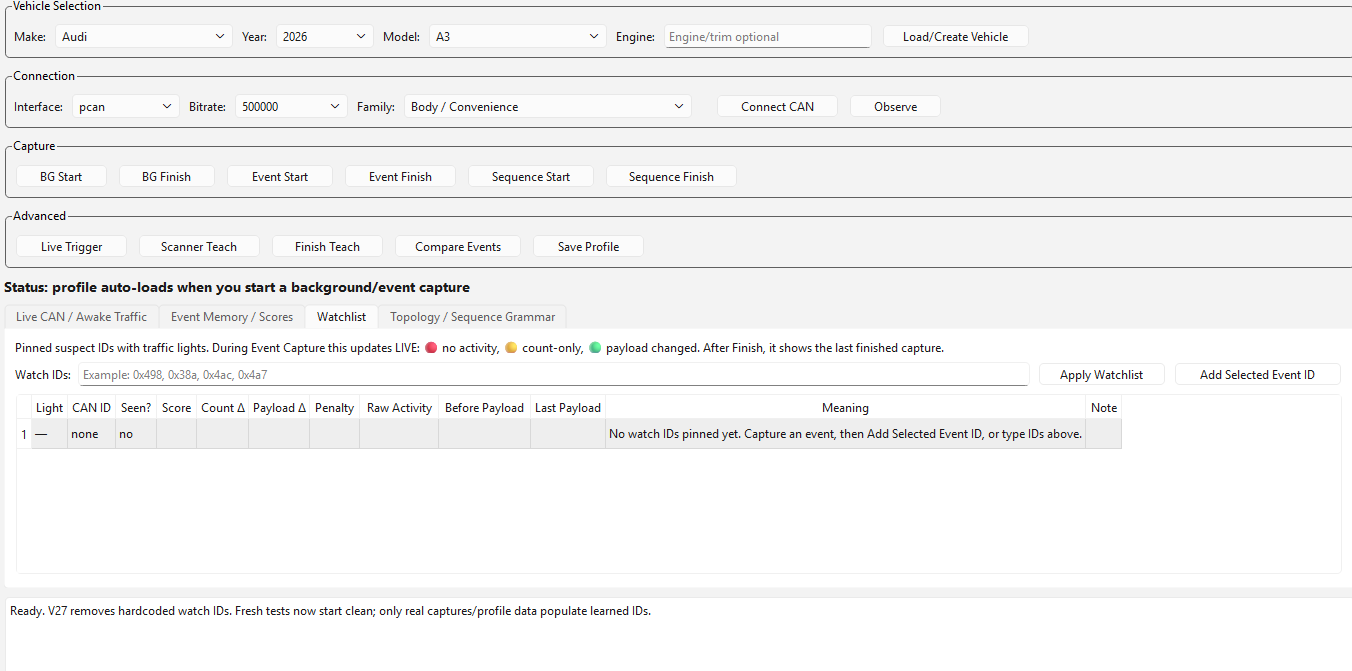
Vehicle Selection
Load or create a vehicle profile by make, model, year, and engine
Connection
Configure interface (pcan, socketcan, etc.), bitrate, and bus family
Capture
BG Start/Finish, Event Start/Finish, and Sequence capture controls
Watchlist
Pin suspect IDs — traffic lights show no activity, count-only, or payload changed
Command Verification
When a technician issues a command — through a vehicle switch or a diagnostic scanner — CANTrak captures the network activity surrounding that event and identifies which arbitration IDs exhibited payload changes.
This answers the most fundamental diagnostic question: was the command actually transmitted, and did the network respond? Without this visibility, a technician can only observe the end result — not whether the command traveled the network correctly.
Define the capture window
Use the Spacebar Clutch to bracket the command event. Press and hold during the switch operation or scanner command.
CANTrak records payload transitions
All arbitration IDs that exhibit byte-level changes within the window are flagged as event participants.
Review the delta report
Compare pre-event and post-event payload states. Verified IDs confirm the command was transmitted and acknowledged.
Use case: A technician commands a window motor through a scan tool. CANTrak verifies that 0x07E8 (BCM response) and 0x0300 (door module) both transitioned — confirming the command reached the correct modules.
Byte-level diff — 0x07E8
0x0580 and 0x06A0 remain active 45s after key-off. Possible parasitic drain source identified.
Network activity timeline
Sleep & Wake Analysis
Parasitic battery drain is one of the most time-consuming diagnoses in automotive service. The root cause is almost always a module that fails to enter sleep mode after key-off. CANTrak monitors network activity over time and identifies which message groups remain active when they should be silent.
Rather than using a milliamp clamp and pulling fuses one at a time, CANTrak gives you a direct view of which arbitration IDs are still transmitting — pointing you toward the responsible module before you touch a fuse box.
Establish a baseline
Record the normal sleep sequence for the vehicle. Note which IDs go silent and at what intervals after key-off.
Monitor post-key-off activity
CANTrak continues monitoring after the ignition is off, tracking which IDs continue to exhibit payload changes.
Identify the outliers
Any ID that remains active beyond the expected sleep window is flagged. These are your parasitic drain candidates.
Use case: A vehicle has a 200mA draw after key-off. CANTrak identifies 0x0580 and 0x06A0 as still active at t+45s. Cross-referencing those IDs with known module ranges narrows the suspect to the telematics control unit.
Module Dropout Detection
When a module loses power, crashes, or drops off the network, its arbitration IDs go silent. CANTrak tracks the last-seen timestamp for every active ID and flags any that stop transmitting unexpectedly — building a timeline of communication failures.
This is particularly useful for intermittent faults where a module drops out under specific conditions — vibration, heat, load — and recovers before a conventional scan tool can capture a code. CANTrak's timeline shows exactly when the dropout occurred relative to other network events.
Establish active ID inventory
CANTrak records all arbitration IDs present on the network and their expected transmission intervals.
Monitor for silence
Any ID that exceeds its expected interval without transmitting is flagged as a potential dropout candidate.
Build the failure timeline
Dropout events are timestamped and correlated with other network activity to isolate the cause and sequence.
Use case: A vehicle sets intermittent U-codes under load. CANTrak captures a dropout of 0x06A0 at t=4.87s, coinciding with a throttle input event — pointing to a power supply issue on the affected module rather than a bus fault.
0x06A0 missed 7 consecutive intervals. Last payload: 1C 00 00 00 00 3A 00 00
Event correlation timeline
All three modes use the Spacebar Clutch
The trigger-based capture system is the foundation of accurate event isolation. By defining a precise capture window, CANTrak minimizes background traffic and improves the signal-to-noise ratio for all three analysis modes.
Ready to go deeper?
The documentation covers setup, hardware requirements, and capture workflows.